
We are delighted to share with you all, an update from our AAN Investment Committee
Dear Investor,
The first half of 2022 was characterised by the harsh reality of elevated inflation and the combative stance taken by central banks around the globe. Already elevated inflation indicators moved higher, causing central banks to hike interest rates further than markets expected. Slower economic growth and recession fears are now front of mind.
All asset classes except cash saw significant falls over the three-month period. Year-to-date returns for some markets were the worst seen in recent times. For example, the S&P 500 had its worst half year since 1970.
Changes to the AAN Core and AAN Growth models were actioned this quarter. The exposure to the Hyperion High Conviction Large Cap strategy was exited completely; further allocations were made to the Blackrock Index Top 20 Model following the investment in the March quarter. Post 30 June the Lazard Global Franchise Fund was added to the models. Within AAN Growth, the June quarter was the first full quarter following a 10% allocation to Perpetual Diversified Real Return Fund (DRRF) and 10% to AAN Index Growth (which replaced a 20% allocation to AAN Index Core).
The Perpetual ESG Diversified Real Return Fund was added to the AAN Sustainable Growth model during the quarter, replacing the allocations to the Australian Ethical Fixed Interest and the Vanguard Ethically Conscious Global Agg Bond Fund.
A least regret policy was taken by central banks over the quarter. Hawkish mindsets were seen across major central banks, resulting in larger than expected increases to key cash rates amidst inflation rates not seen this high in decades, see Figure 1. The speed of central bank liquidity withdrawals is increasing. Inflation indicators are even more important at present, with central banks ready to tame inflation at the expense of economic growth. Queue stagflation and recession concerns.
Figure 1: Global Inflation Heat map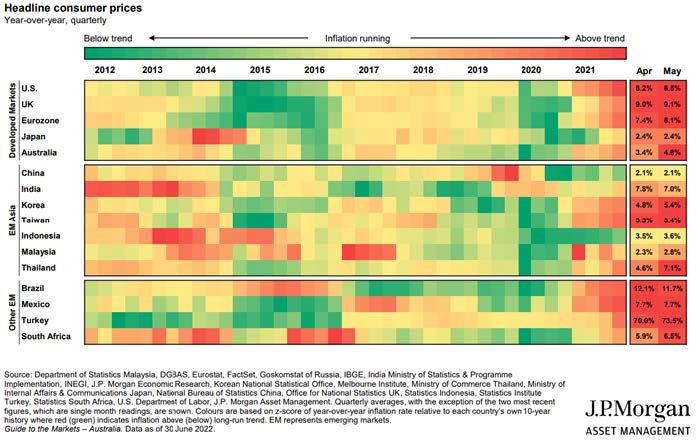
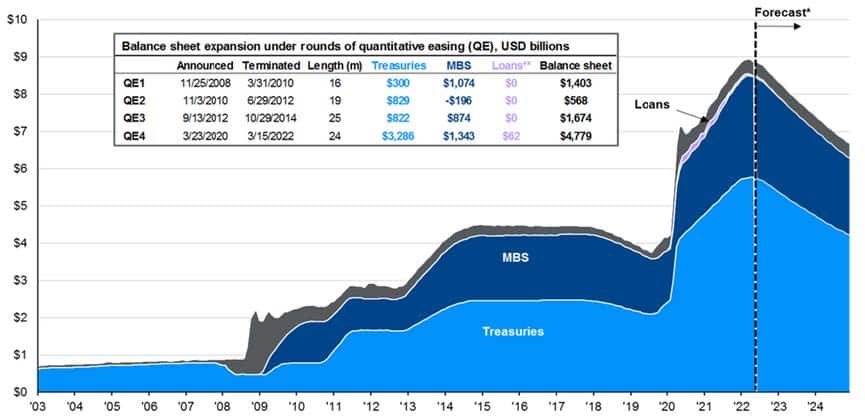
In mid-June the Federal Open Market Committee (FOMC) increased the target range for the Federal Funds rate by 75bp to a 1.5% – 1.75% range. Further, quantitative tightening started during the quarter, with a total of US$47.5bn assets removed from the balance sheet. This was made up of US$30bn Treasuries and US$17.5bn mortgage-backed securities (MBS). To give some context, Figure 2 below shows the progress and magnitude of quantitative easing since 2003.
Figure 2: US Federal Reserve QE and QT
On the other side of the Atlantic, the European Central Bank ended net asset purchases under various programs at the end of the quarter. The asset purchase programs had been in place since October 2014. Cumulatively, the stock of bonds stood at over €3.4tn by the end of June 2022. President of the ECB, Christine Lagarde, also indicated they would raise policy rates for the first time in 11 years in July. Lagarde cited wage inflation and lingering global supply chain disruptions as headwinds to lower inflation. The outlook for energy and commodities is uncertain due to the ongoing Russia-Ukraine war. Inflation could persist for longer than expected.
A theme within supply chains has been a move to focus on ‘surety’ given Russia-Ukraine war, rather than the most efficient, low- cost solution which has been one of the drivers of globalisation. The theme could be characterised as a move from ‘just-in-time’ to ‘just-in-case’. Geopolitics suggests the world is shifting back to geographic blocs.
Given the various sanctions against Russia, an interesting geopolitical perspective within this is the validity of US Treasuries being used as reserve currency holdings by different sovereign states. If the US is placing sanctions on Russian holdings of US Treasuries, then what does it mean for other Eastern countries holding US Treasuries? The Treasuries aren’t as ‘risk-free’ as they used to be.
Figure 3: AUD/USD exchange rate
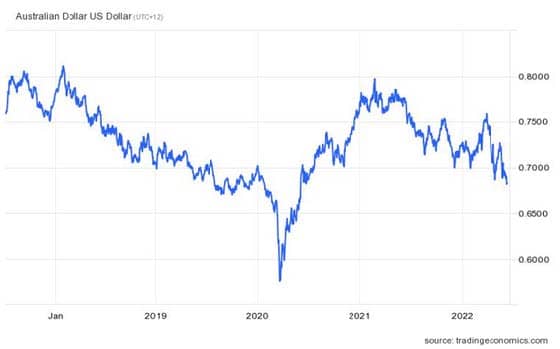
In Australia, the RBA increased the cash rate by another 50bps to 1.35%. This was above market expectations. Guidance was provided indicating further hikes, “size and timing of future interest rate increases will be guided by the incoming data and the Board’s assessment of the outlook for inflation and the labour market”.
The AUD/USD depreciated from 74.9c at the end of Q1 2022 to 69c by the end of June 2022, see Figure 3. The move below 70c was a 10% move from the long-term average, meaning the Investment Committee officially moved to active monitoring of the currency. A move down to 64c would trigger the IC to consider increasing hedging.
A major risk to keep front of mind is a potential central bank error. Does monetary policy have the same impact on supply- driven inflation versus demand-driven inflation? Empirical evidence suggests monetary policy is more effective at taming demand-driven inflation. Central banks must understand the make-up of inflation. For example, how much is derived from excess demand, and how much is derived from supply chain disruptions?
Central banks won’t have the safety of Quantitative Easing (QE) this time around. The ability of central banks to support lower rates with QE is less likely because of the extraordinary amounts of existing debt. Future growth will be harder to attain because, by definition, borrowing means that consumption is brought forward in time. Credit worthiness should be a focus as interest rates rise.
Central banks effectively distorted true price discovery with QE. Investors in fixed interest should evaluate the return ‘of’ capital, not just the return ‘on’ capital.
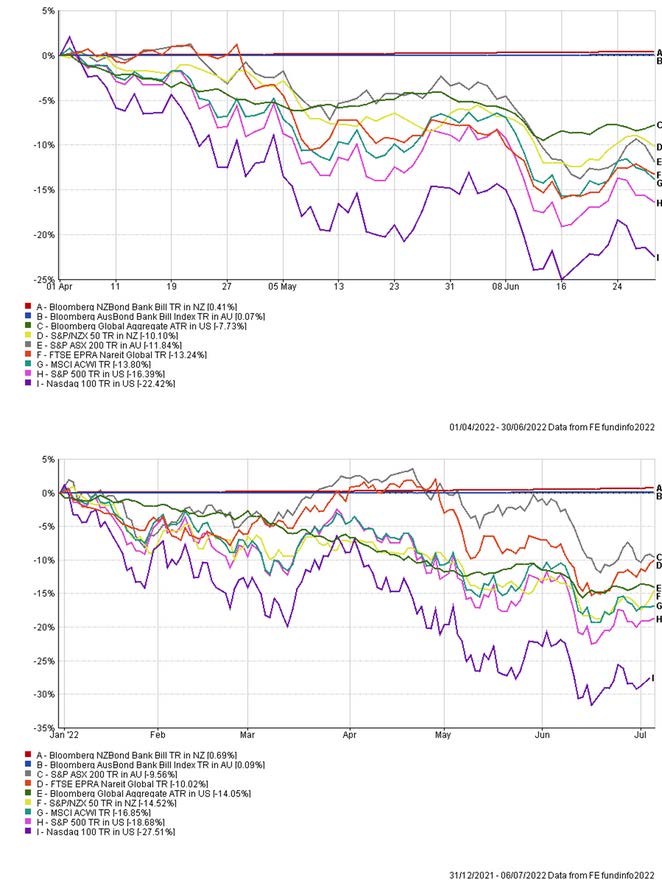
It was difficult to avoid falls in major investment markets through the June quarter. All asset classes except cash saw significant falls over the three-month period, see Figure 4. Combined with the falls in markets in the March quarter, year-to-date returns for some markets were the worst seen in recent times. The S&P 500 had its worst half year since 1970. The Bloomberg Global Aggregate bond index had its worst decline ever (-14%), the next worst decline was back in 1999 when the index was down ~6%. Commodity prices were lower towards the end of the quarter, flowing through to resource stocks, and thus pulling the ASX 200 return downward in June.
Figure 4: Major Indices – June Quarter Returns and YTD Returns
Bad news in the past has been good news for markets, as it meant that central banks would force interest rates low, which was good for asset prices. This time though, inflation has bolted, central banks can’t employ QE and push interest rates lower thus supporting asset prices (China being an exception at present). Can inflation be reined in without jeopardising economic growth?
The key question looking forward is, how long will it take before elevated levels of inflation come back down to generally accepted levels which are closer to central bank targets? Continued pressure on higher interest rates from rising food and energy costs will chip away at consumer confidence. Purchasing manager indices and business confidence surveys are pointing to the downside risks. There is unlikely to be much let up in policy tightening for the rest of 2022, central banks are front loading interest rate hikes. Long bond yields haven’t stabilised, but once they do this will allow for equity valuation support. Company margins and earnings will be challenged. Keep an eye on earnings downgrades.
To view the entire Quarterly Investment Update, click here
Regards,
AAN Investment Committee
General Advice Warning
The information is published by AAN Asset Management Pty Ltd ABN 37 609 544 836, Corporate Authorised Representative 1238848 of Australian Advice Network AFSL 472901 | ABN 13 602 917 297. The information contained herein is not intended to be advice and does not take into account your personal circumstances, financial situation and objectives. The information provided herein may not be appropriate to your particular financial circumstances and we encourage you to obtain advice from your financial adviser before making any investment decisions. Please be aware that investing involves the risk of capital loss and past results are not a reliable indicator of future performance and returns. AAN Asset Management Pty Ltd makes no representation and give no accuracy, reliability, completeness or suitability of the information contained in this document and do not accept responsibility for any errors, or inaccuracies in, or omissions from this document; and shall not be liable for any loss or damage howsoever arising (including by reason of negligence or otherwise) as a result of any person acting or refraining from acting in reliance on any information contained herein. No reader should rely on this document, as it does not purport to be comprehensive or to render personal advice. Please consider the Product Disclosure Statement and any relevant TMDS before investing in the model.
Performance is based on a model portfolio and is gross of investment management and administration fees, but net of transaction costs. The total return performance figures quoted are historical and do not allow for the effects of income tax or inflation. Total returns assume the reinvestment of all portfolio income. Past performance is not a reliable indicator of future performance. Portfolio holdings may not be representative of current or future recommendations for the portfolio. The securities listed may not represent all of the recommended portfolio’s holdings.