
US Interest rates have been making headlines in recent months, but do they really matter to Australian investors? The short answer is they do, a lot.
Changes in US interest rate settings have made a big impact on investment returns from bonds and shares over the past year, while uncertainty about the future direction of interest rates is also weighing heavily on markets.
Where are rates headed?
The US Federal Reserve has increased its federal funds rate (which controls short-term interest rates) nine times in the current cycle from close to zero in 2015 to 2.5 per cent, as the US economic recovery gathered steam.
As late as last December the Fed was forecasting two more rate hikes in 2019. Then in early January it announced a ‘patient’ approach, with increases only if and when the economy allowed. Respected market observer and former Pimco chief, Mohamed El-Erian now expects the next move will be a cut, but not until 2020.i
Over the same period, the Reserve Bank of Australia cut the official cash rate from 2 per cent to a record low of 1.5 per cent where it has remained since 2016. Until recently, the consensus was that the next interest rate move would be up, but many economists now expect a rate cut.ii
This turnaround in sentiment in the US and Australia is due to weaker economic figures, the escalating trade war between China and the US and fears of a China slowdown. Australia is also contending with slow wages growth and falling property prices.
Late last year nerves got the better of investors and global shares fell sharply. Shares bounced back in January after the US Fed’s about-turn on interest rate policy, in late recognition of the softer outlook for growth. But bond markets had been predicting an economic slowdown for some time, due to something called the yield curve.
What is the yield curve?
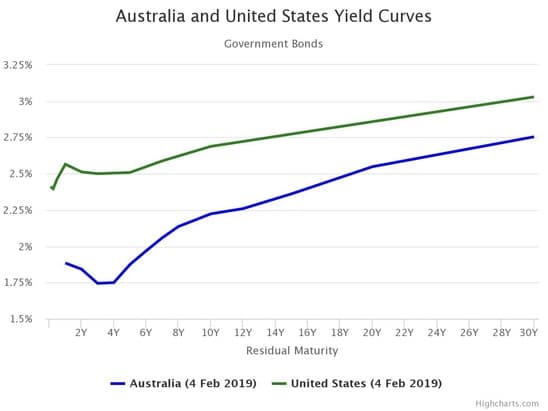
The yield curve is a graph that plots the yields currently offered on bonds of different maturities, ranging from a few months to 30 years (see graph). The yield on a bond is the annual interest paid as a percentage of the bond price.
The ‘typical’, or positive, yield curve is a gently rising line as maturities increase because investors expect a higher return for the added risk of holding an investment for lengthy periods. A flat yield curve occurs when yields on short and long securities are similar.
The relatively rare inverted yield curve, where short-term yields are higher than long-term yields, looks like a downhill slide.
Market watchers use yield curves, especially of US Treasury bonds, to test which way the economic wind is blowing. A positive yield curve is a sign of continuing economic expansion – as the economy grows, interest rates tend to rise to keep a lid on inflation. Whereas an inverse yield curve implies that investors expect sluggish economic growth, low inflation and hence lower interest rates.
What is it telling us?
At present yield curves are flattening, especially in the US. While the Federal Funds rate has increased to 2.5 per cent over the past year, the yield on 10-year Treasury Bonds has fallen slightly to 2.68 per cent as bond markets priced in an economic slowdown.iii
After a strong period of economic growth, the Fed announced in December that it sees US growth slowing from 3 per cent in 2018 to 2.3 per cent in 2019 and 2 per cent in 2020.
By suspending further rate hikes, the Fed may have avoided further falls in long term bond yields and an inverted yield curve which would have set off alarm bells in financial markets.
By comparison we’ve seen only a slight flattening in the Australian yield curve. The RBA forecasts local growth to hold at around 3 per cent this year but says downside risks are increasing due to the impact of sluggish wages and falling property prices on household spending.iv
What does this mean for investors?
Interest rates don’t directly affect share prices, but they do affect the cost of borrowing and decisions by businesses and consumers which can flow through to corporate profits and share prices.
As for bonds, as interest rates fall on new bond issues, prices rise for existing bond issues paying higher interest.
This helps explain why Australian fixed interest topped the asset class performance chart in 2018, up 4.5 per cent, while Australian shares fell 2.8 per cent. Even cash, up 1.9 per cent, outshone shares.v
Of course, past returns are no guide to future performance. What the past does teach us though is the importance of diversification. While returns from bonds and cash may not shoot the lights out, they help cushion the impact of falling share prices.
While the yield curve has proved to be a useful indicator of future economic slowdowns, it is simply a prediction based on current market sentiment and can change direction with the slightest economic breeze.
If you would like to discuss your overall investment strategy, give us a call.
i https://www.cnbc.com/2019/02/05/mohamed-el-erian-fed-next-rate-move-more-likely-a-cut-than-a-hike.html
ii Finder, RBA cash rate survey, 4 February 2019, https://www.finder.com.au/press-release-feb-2019-rba-survey-experts-predict-cash-rate-cut-to-come-not-hike
iii Trading economic as at 28 February 2019, https://tradingeconomics.com/bonds
iv Statement by Philip Lowe, RBA Governor, 5 February 2019, https://rba.gov.au/media-releases/2019/mr-19-01.html
v Cuffelinks, edition 291, https://mailchi.mp/cuffelinks/edition-291